Negociar Forex pode ser intimidante quando você está começando, com preços em constante movimento, condições de mercado que mudam o tempo todo e notícias de última hora acontecendo em todo o mundo. No entanto, isso não precisa ser limitante. Ao aprender a ler gráficos ou acompanhar notícias financeiras, você pode otimizar a sua abordagem de negociação e melhorar a sua tomada de decisões.
Neste artigo, vamos analisar gráficos e notícias em termos simples. Você aprenderá como os gráficos refletem o comportamento do mercado, quais são os padrões mais importantes e como combinar esse conhecimento com atualizações de notícias em tempo real para negociar de forma mais inteligente.
Por que os gráficos são importantes para a negociação de Forex?
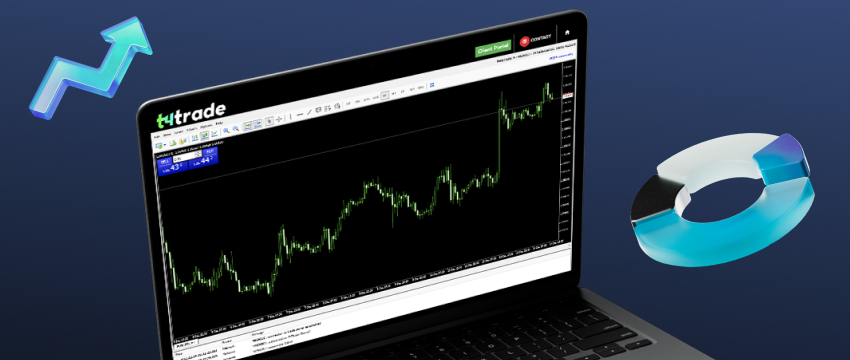
Os gráficos são muito importantes na negociação de Forex. Eles fornecem uma visão clara do movimento dos preços, permitindo que os traders identifiquem padrões, tendências e pontos de viragem. Em vez de ler relatórios longos e tabelas de dados intermináveis, os gráficos de Forex transformam informações complicadas em um formato visual claro.
Os gráficos mostram como os preços se moveram anteriormente e ajudam os traders a especular sobre como podem se mover a longo prazo. É possível ver esses movimentos em segundos, minutos, horas ou meses, dependendo do período de tempo selecionado.
Como resultado, os gráficos são muito úteis para os traders, sejam eles scalpers, que procuram pequenos movimentos de preço, ou traders de longo prazo, que analisam tendências maiores.
No entanto, deve-se sempre utilizar os resultados passados com cautela e gestão de risco.
Se os traders não tivessem acesso aos gráficos, provavelmente seria impossível acompanhar a volatilidade ou gerir o risco de forma eficaz. Portanto, independentemente do nível de complexidade, todas as estratégias começam com a análise de gráficos.

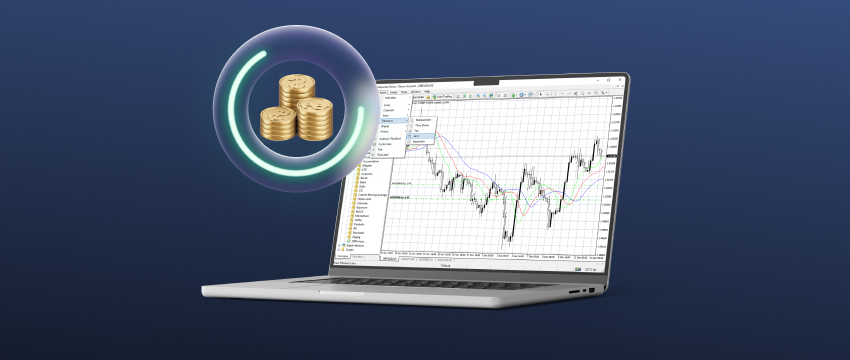
5 tipos de gráficos de Forex
Existem vários tipos de gráficos usados pelos traders para analisar o mercado. Cada um destaca o comportamento dos preços de uma forma diferente.
Gráfico de linha de negociação Forex:
Esse tipo simples mostra o preço de fechamento de cada período, tornando-o ideal para identificar tendências rapidamente.
Gráfico de barras (HLOC):
Este tipo destaca o sentimento intradiário e a volatilidade ao mostrar o preço máximo, mínimo, de abertura e de fechamento de cada período.
Gráfico de velas japonesas (Candlestick) de negociação Forex:
Este é um dos instrumentos de Forex mais populares. Embora as velas enfatizem as mesmas informações dos gráficos de barras, elas são visualmente mais claras, o que torna os padrões mais fáceis de identificar.
Gráfico de Montanha (Área):
Esta é uma variação do gráfico de linha que sombreia a área abaixo da linha. É frequentemente utilizado para uma visão rápida e de alto nível.
Heikin-Ashi:
Esta é uma variação mais avançada dos candlesticks que suaviza o ruído e ajuda os traders a focarem na tendência subjacente.
Os gráficos de velas japonesas dominam a negociação de Forex. Eles fornecem uma visão rápida do momentum de alta ou de baixa, tornando-se importantes para as decisões de negociação.
Quais são alguns dos principais padrões de gráfico que os traders devem conhecer?
Os gráficos só são úteis quando você sabe como eles funcionam e o que deve observar. Padrões de gráfico comuns fornecem aos traders informações valiosas sobre a direção potencial do mercado.
Existem certos padrões nos preços que se repetem no Forex, portanto, reconhecê-los dá uma vantagem aos traders.
Por exemplo, o padrão Cabeça e Ombros indica uma reversão, onde um pico — a cabeça — é acompanhado por dois picos menores — os ombros — sugerindo que uma tendência pode estar chegando ao fim.
Em seguida, existem os triângulos ascendentes, descendentes ou simétricos, que geralmente indicam uma continuação enquanto os preços se estreitam antes de romper na direção da tendência.
Bandeiras e Flâmulas são padrões de continuação de curto prazo que aparecem após movimentos bruscos, sugerindo que o momentum possivelmente continuará depois que a breve pausa terminar.
Enquanto isso, os padrões de Topos e Fundos Duplos podem indicar uma reversão que ocorre quando o preço não consegue romper para cima (topo duplo) ou para baixo (fundo duplo). Por fim, o padrão de Vela Engolfante indica uma forte reversão quando uma vela engole a anterior.
Tipos de notícias de negociação Forex que movimentam os mercados
Assim como os padrões de gráfico, existem certos tipos de notícias que têm um grande impacto nos preços das moedas. Se você as compreender, será mais fácil esperar volatilidade e se preparar para as oportunidades que possam surgir.
Anúncios dos bancos centrais:
Decisões sobre taxas de juro, comunicados de política monetária e discursos de banqueiros centrais muitas vezes levam a movimentos bruscos. Normalmente, quanto mais altas as taxas de juro, mais forte a moeda. Cortes nas taxas podem enfraquecê-la.
Divulgação de dados econômicos:
Os relatórios de Emprego Não Agrícola dos EUA, crescimento do PIB, inflação (IPC) e taxas de desemprego podem mudar o sentimento imediatamente. Os traders acompanham cuidadosamente os calendários econômicos para estarem preparados para esses eventos.
Eventos geopolíticos:
Eventos como guerras, eleições ou negociações comerciais podem gerar incerteza. Nesses casos, geralmente há uma maior procura pelo dólar americano, iene japonês ou franco suíço, que são considerados moedas de “refúgio seguro”.
Sentimento de mercado e tolerância ao risco:
Há momentos em que não se trata apenas de um evento isolado, mas sim do sentimento geral. Isso se refere a se os traders estão ou não confiantes. O sentimento movimenta os mercados. Por exemplo, quando há incerteza global, os traders podem vender moedas de alto risco e comprar moedas de refúgio seguro.
Se você aprender quais notícias são mais valiosas, poderá filtrar o ruído e concentrar-se nos eventos que realmente têm impacto nos mercados e, consequentemente, na sua estratégia de negociação.

Usando gráficos e notícias juntos na negociação de Forex
Os gráficos mostram o que está acontecendo. As notícias, no entanto, explicam o porquê. Se você confiar apenas em um dos dois, a sua abordagem de negociação não estará completa. Por exemplo, um gráfico pode mostrar o fortalecimento do USD, mas notícias sobre cortes na taxa de juro do FED podem fornecer as razões por trás disso. Ao combinar ambos, você obtém uma visão completa.
Pesquisas e estudos mostraram que combinar padrões de gráfico com o sentimento do mercado leva a resultados mais consistentes. Se, por exemplo, os gráficos mostrarem resistência no EUR/USD, mas as notícias confirmarem dados mais fracos da Zona do Euro, os traders ganham mais confiança em assumir uma posição curta no par.
Dicas para começar
Juntar todos os pontos acima nem sempre precisa ser difícil. A seguir estão alguns passos simples para começar:
Comece abrindo uma conta demo para praticar e testar gráficos e estratégias sem arriscar dinheiro real.
Use múltiplos períodos de tempo para analisar gráficos tanto em níveis de curto quanto de longo prazo. Dessa forma, você garantirá que as suas negociações estejam alinhadas com a tendência maior.
Verifique diariamente o calendário de notícias, procurando eventos como decisões de bancos centrais ou dados de emprego que podem influenciar os mercados instantaneamente.
Concentre-se na gestão de risco usando ordens de stop-loss e evitando arriscar mais de 1–2% do seu capital em uma única negociação.
Se você seguir esses passos, manterá a sua abordagem de negociação simples, organizada e talvez menos estressante.
Considerações finais
Para entrar na negociação de Forex de forma eficaz, não é necessário dominar todos os indicadores técnicos ou acompanhar todas as manchetes de notícias. A chave para negociar com eficácia é o equilíbrio entre os dois.
Enquanto os gráficos ajudam você a identificar padrões e movimentos de preço, as notícias explicam as razões pelas quais os mercados se movem e, na maioria das vezes, sinalizam quando grandes mudanças podem estar por vir.
Se você se concentrar nos principais padrões de gráfico e ficar de olho nas principais notícias, incluindo atualizações dos bancos centrais, dados econômicos ou eventos geopolíticos, poderá simplificar bastante o seu processo de tomada de decisões.
Combinar os dois lhe dará as ferramentas necessárias para identificar oportunidades e o contexto para agir sobre elas com confiança.
Isenção de responsabilidade: Este material destina-se apenas a fins informativos e educativos e não deve ser considerado como conselho ou recomendação de investimento. A T4Trade não se responsabiliza por quaisquer dados fornecidos por terceiros referenciados ou hiperligados nesta comunicação.