When it comes to forex trading, the ability to spot chart patterns is one of the most reliable ways to anticipate future movements in prices.
Patterns show up because there is often a repetition in human behaviour in the 금융 시장; fear, greed and momentum always leave their marks on price forex charts.
What’s important is to know the patterns that are most reliable and how to trade them.
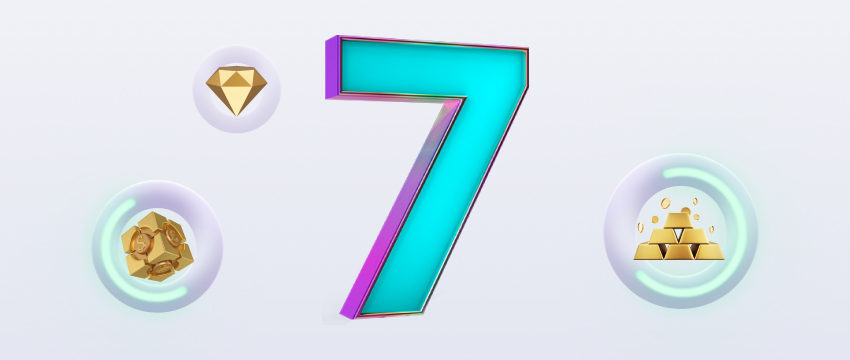
In this article, we will dive into 7 chart patterns that traders trust the most. These aren’t just magic patterns, but do give you an edge by showing you where buyers and sellers are likely to take control.
Why do forex chart patterns work?
The reason forex chart patterns are useful comes down to psychology. Trading is not only about numbers and data. It is also about emotions like fear, greed, and hope.
For instance, traders will notice if a stock 또는 currency pair keeps failing to break above a specific price. They start to think that the price has reached its peak and therefore, they sell. Because of this selling pressure, the price drops and forms a visible pattern on the chart.
The same price pattern shows up again repeatedly across various markets because human behaviour tends to repeat. There is no pattern that is 100% reliable, but the ones discussed in this article have been studied for decades and more reliable than random guessing.
However, past results don’t necessarily indicate future performance, these patterns must be used with caution and in conjunction with risk management.
1. Head and shoulders forex chart pattern
One of the most well-known reversal patterns is the Head and Shoulders. As per the actual name, it looks like three peaks. The first one forms the left shoulder, with the highest peak being the head, and the last lower peak forming the right shoulder.
The neckline, which is the line connecting the lows, is very important. When the price breaks below this neckline, it often indicates that the trend is about to reverse downward.
The Inverse Head and Shoulders, which is the opposite version, works in the same way but signals the end of a downtrend and the beginning of a new rise.
Traders favour this pattern because it is usually reliable, especially if combined with trading volume. However, the important thing is patience and waiting for the neckline to break prior to entering a trade so as to avoid jumping in too early.
2. Double Tops and Double Bottoms chart pattern
Two of the most straightforward and dependable reversal patterns are the Double Top 택하고 Double Bottom. A Double Top forms once the price goes up, hits a resistance level, falls back and then goes up again to the same level but fails to break higher. That failure often indicates weakness, and the price usually drops after that.
In the opposite version, the Double Bottom, the price falls to a support level, bounces and then retries. When it cannot break lower, it usually means strength and there is an upward climb.
These patterns appear when trends are running out of momentum. Like the Head and Shoulders, they should always be confirmed by a breakout before you take any action on them.
3. Triangles
Triangles are another set of advanced patterns that show a conflict between buyers and sellers. The price is gradually narrowing into a triangle shape before breaking out.
There are three main types.
The first one, the Ascending Triangle, has a flat top and a rising bottom, indicating that buyers are getting stronger, pushing the price higher. This is usually bullish.
The second type, a Descending Triangle is the opposite and has a flat bottom and falling highs, showing seller strength and often leading to a downward move.
The third and final one, a Symmetrical Triangle slopes inward from both sides suggesting that a breakout might occur in either direction.
Triangles are popular because with them, there is time for traders to prepare. They do not make sudden moves. Rather, they gradually build pressure prior to an explosive breakout.
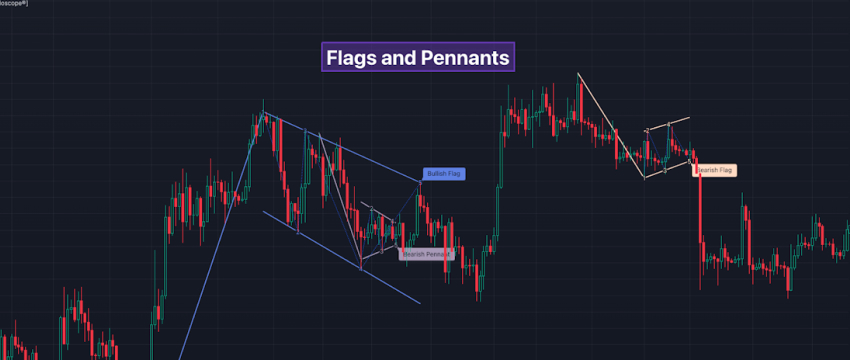
4. Flags and Pennants
Before moving on in the same direction, prices usually pause after a strong move. Flags and Pennants appear during this pause.
The former looks like a small rectangle that leans against the main trend, whereas the latter looks like a tiny triangle. Let’s say there’s an upward market surge. Traders take quick profits causing a short pullback.
However, new buyers are then jumping in, and the trend goes on. That is a textbook flag or pennant in action. These patterns aren’t known for being long-lived. Nonetheless, they often lead to fast and sharp moves after the pause ends.
5.Wedges
Wedge shapes are similar to triangles but more elongated. Although they are more stretched out, they are similar to triangles. A Falling Wedge slopes downward and often indicates that a bullish reversal is about to come. A Rising Wedge on the other hand, slopes upward and usually warns of a bearish reversal.
Wedges are special because they show momentum slowing down. For instance, a Rising Wedge may form, warning that sellers are about to take control if prices keep increasing but at a weaker pace. With indicators such as RSI 또는 MACD, traders often confirm wedge patterns to be certain that momentum is fading.
6. Cup and Handle
This is a bullish continuation pattern that looks exactly as the name suggests. The cup refers to a rounded bottom, showing that selling pressure is easing. The handle refers to a short pullback that occurs before the price breaks out to new highs.
This chart pattern takes more time to form compared to many others and is very common in stocks. Swing traders prefer it due to the fact that it offers time to plan entries and exits. The breakout above the handle’s resistance is the key moment which is usually more trusted when accompanied by strong trading volume.
7. Diamond Formation
The last pattern is less common but very strong when it shows up. It forms a diamond shape on the forex chart and usually indicates a big reversal.
A Diamond Top appears after a strong rally and signals the possibility of a big drop ahead whereas a Diamond Bottom appears after a steep decrease and indicates the possibility of a large rally.
Diamonds are not that easy to identify in real time because they are similar to other patterns. However, once confirmed, they can mark some of the most dramatic turning points in the market.
How to trade chart patterns?
Learning to spot patterns is only part of the journey. You will also need to learn how to use them effectively. The most important rule is to wait for confirmation. A shape will not always play out. You’ll need to wait for the breakout in the expected direction before you make your move.
Also, it’s important to use stop losses. Even the most experienced traders may be wrong. Stop losses protect you from big losses. Combining chart patterns with RSI, MACD 또는 moving averages can also improve accuracy by confirming what the price action is telling you.
Timeframes matter too. Daily charts carry more weight than short-term ones. Spotting patterns on a demo account is also useful.

Final thoughts
Chart patterns help traders read the market’s behaviour and spot potential moves. The seven forex chart patterns covered above are among the most common ones. Combined with patience and risk management, they can guide smarter trading decisions.
Disclaimer: This material is for general informational and educational purposes only and should not be considered investment advice or an investment recommendation. T4Trade is not responsible for any data provided by third parties referenced or hyperlinked in this communication.